Salesforce reports do not have a built-in option to remove duplicate records. Usually, the goal is to display unique values in a report rather than delete duplicates from Salesforce. This guide explains five approaches: Show Unique Count, Group By with hidden detail rows, Cross Filters, the Power of One formula field, and exporting report data for cleanup. The best method depends on your report type and the result you need.
Why Your Salesforce Report Shows Duplicates
Salesforce report duplicates usually fall into two categories. Identifying the correct one determines the fix.
There are Two Types of Duplicates:
-
1
Display-Layer Duplicates
It occurs when a report type includes parent-child relationships. Salesforce creates one row for each matching parent-child combination.
For example, an “Accounts with Contacts” report shows an Account with 10 Contacts as 10 rows. The Account record exists once in Salesforce, but the report type relationship generates multiple rows because each row represents a different related Contact.
-
2
Data-Layer Duplicates
Data-layer duplicates occur when the same entity exists as separate records in Salesforce.
For example, “John Smith” and “Jon Smith” may share the same email address and phone number but have different Record IDs. This is a database-level duplication issue. Report configuration cannot fix it.
These cases require Salesforce Duplicate Management features such as Matching Rules, Duplicate Rules, and merge workflows.
Which Type Do You Have?
-
1
In Report Builder, manually add the Record ID field for the relevant object. Salesforce does not include it by default.
-
2
Export the report as a CSV.
-
3
Review the Record ID column.
How to interpret the result:
- Repeated parent Record IDs combined with different related child records usually indicate display layer row multiplication.
- Different Record IDs with the same business data (email, phone number, company name) indicate true duplicate records.
The Tabular Report Misconception
Many sources claim that tabular reports reduce duplication. The actual mechanics are a bit different.
A single-object report type avoids parent-child row duplication by not including related child objects. However, true duplicate records can still exist in the object itself.
A Tabular report built on a parent-child report type produces the same underlying row count as Summary or Matrix reports.
For example, an Account with five Contacts generates five rows in all three report formats.
The difference is in presentation:
- Tabular reports display every row individually.
- Summary and Matrix reports group related rows under shared headers.
Grouping changes how the report appears in the UI, but it does not reduce the underlying dataset. CSV exports still contain all rows.
The report type determines whether parent-child row multiplication occurs. The report format controls presentation only.
Select the report type based on the data relationship required by the use case. If both Account and Contact data are needed, parent-child row multiplication is expected behavior. Select the report format afterward based on how users need to view the data.
Show Unique Count
Show Unique Count is a counter, not a filter. It calculates how many distinct values exist in a column and displays that number as a grand total without removing, hiding, or modifying any rows. All records remain visible
Show Unique Count performs two actions:
-
Grand total displays the count of unique values across the entire report at the bottom.
-
Subtotals per group in Summary and Matrix reports, display a unique count beneath each grouping.
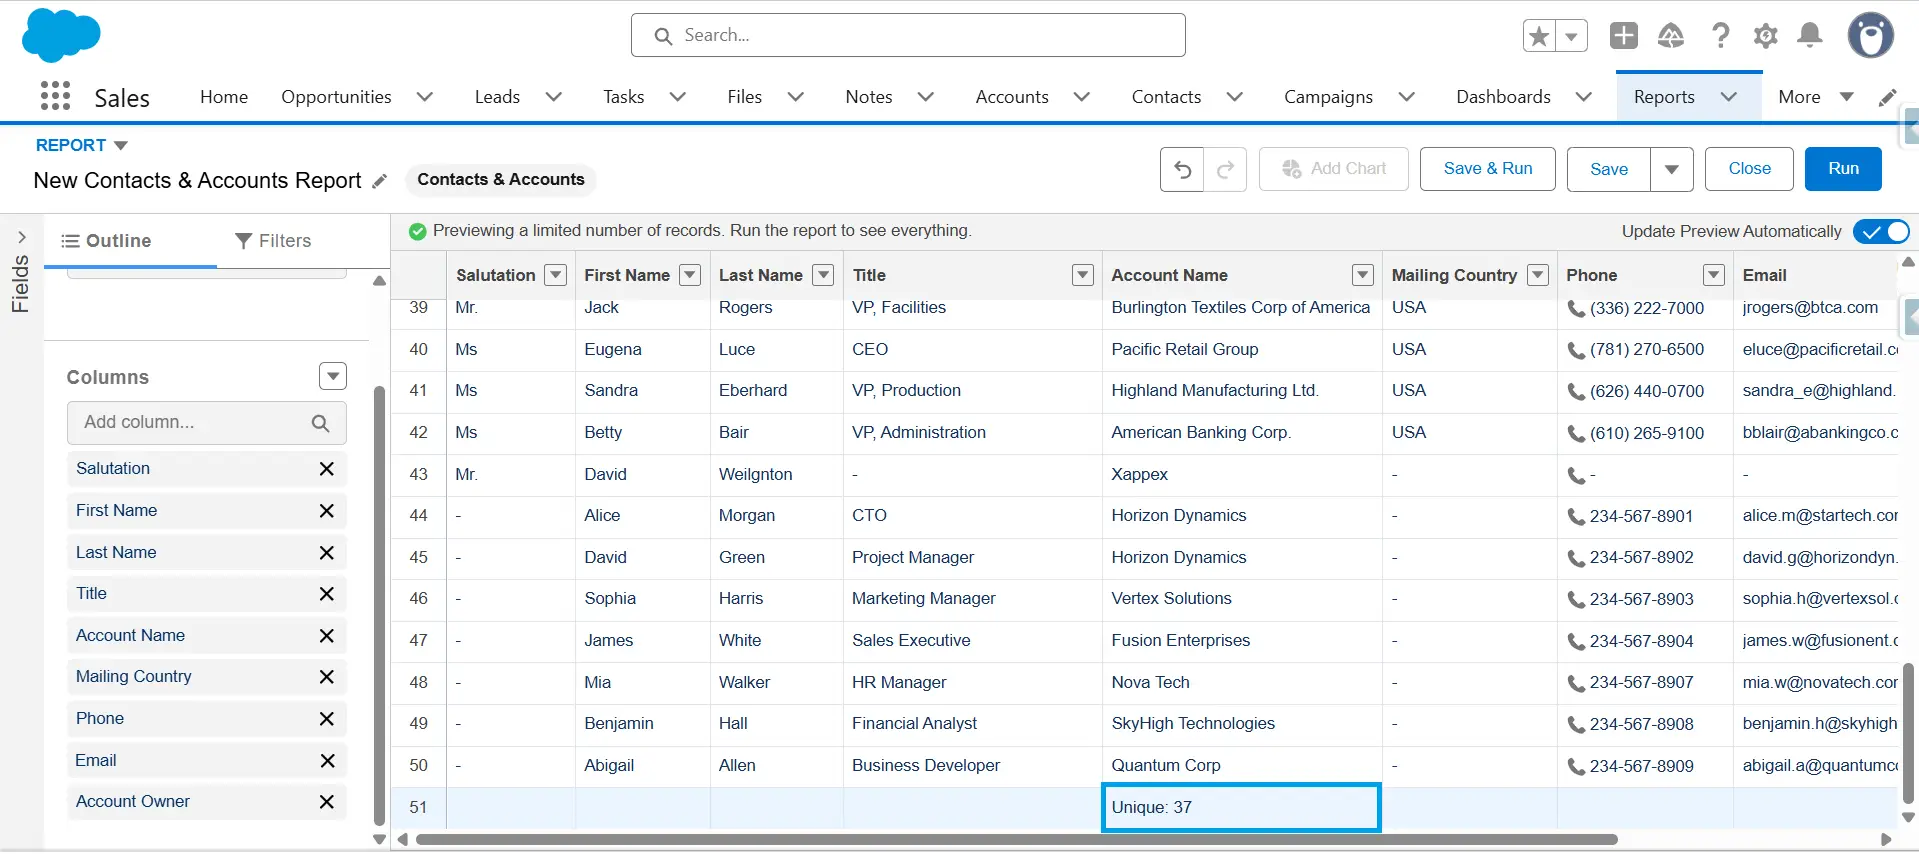
An “Accounts with Contacts” report returning 50 rows with Show Unique Count enabled on Account Name displays Unique Count:37 at the footer. This means 50 rows reference 37 distinct accounts, each appearing multiple times due to multiple contacts.
Show Unique Count adds a tally. It does not alter the data displayed.
What Show Unique Count Does Not Do
-
Remove duplicate rows
-
Hide records from the report view
-
Filter results by unique value
-
Replace row-level data with aggregated data
If the goal is to display only one row per unique value, Show Unique Count is not the right tool. It measures and does not transform.
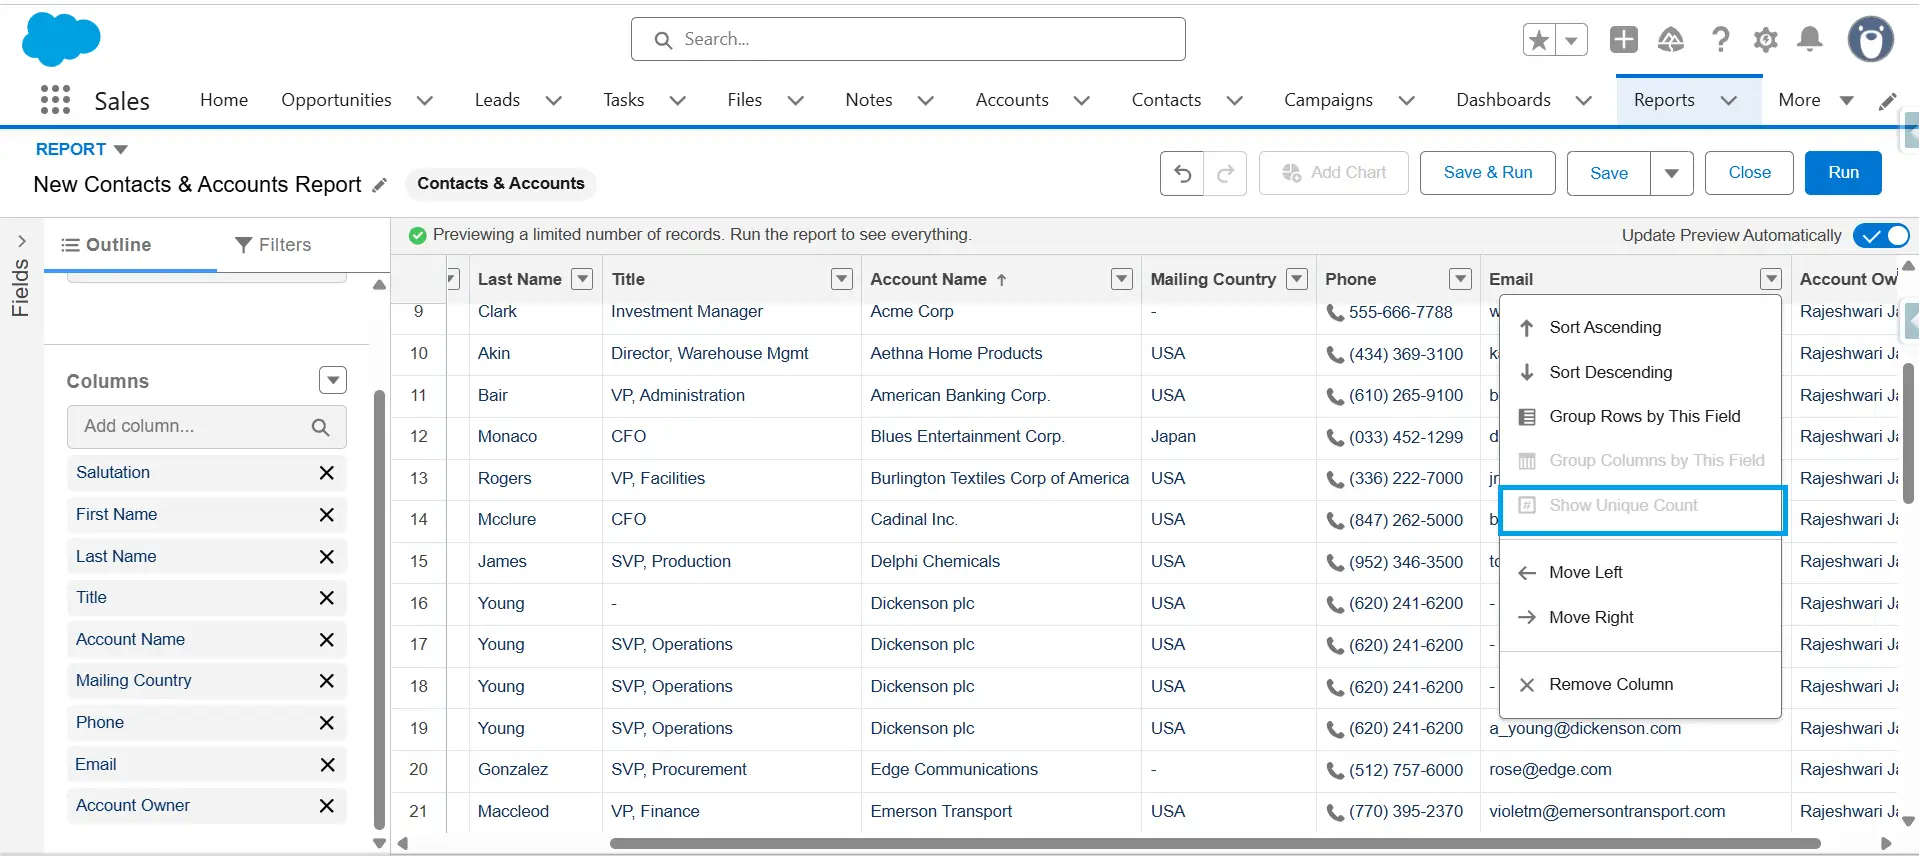
How to Enable Show Unique Count (UI Steps)
-
1
Open the report and click Edit. Locate the target column.
-
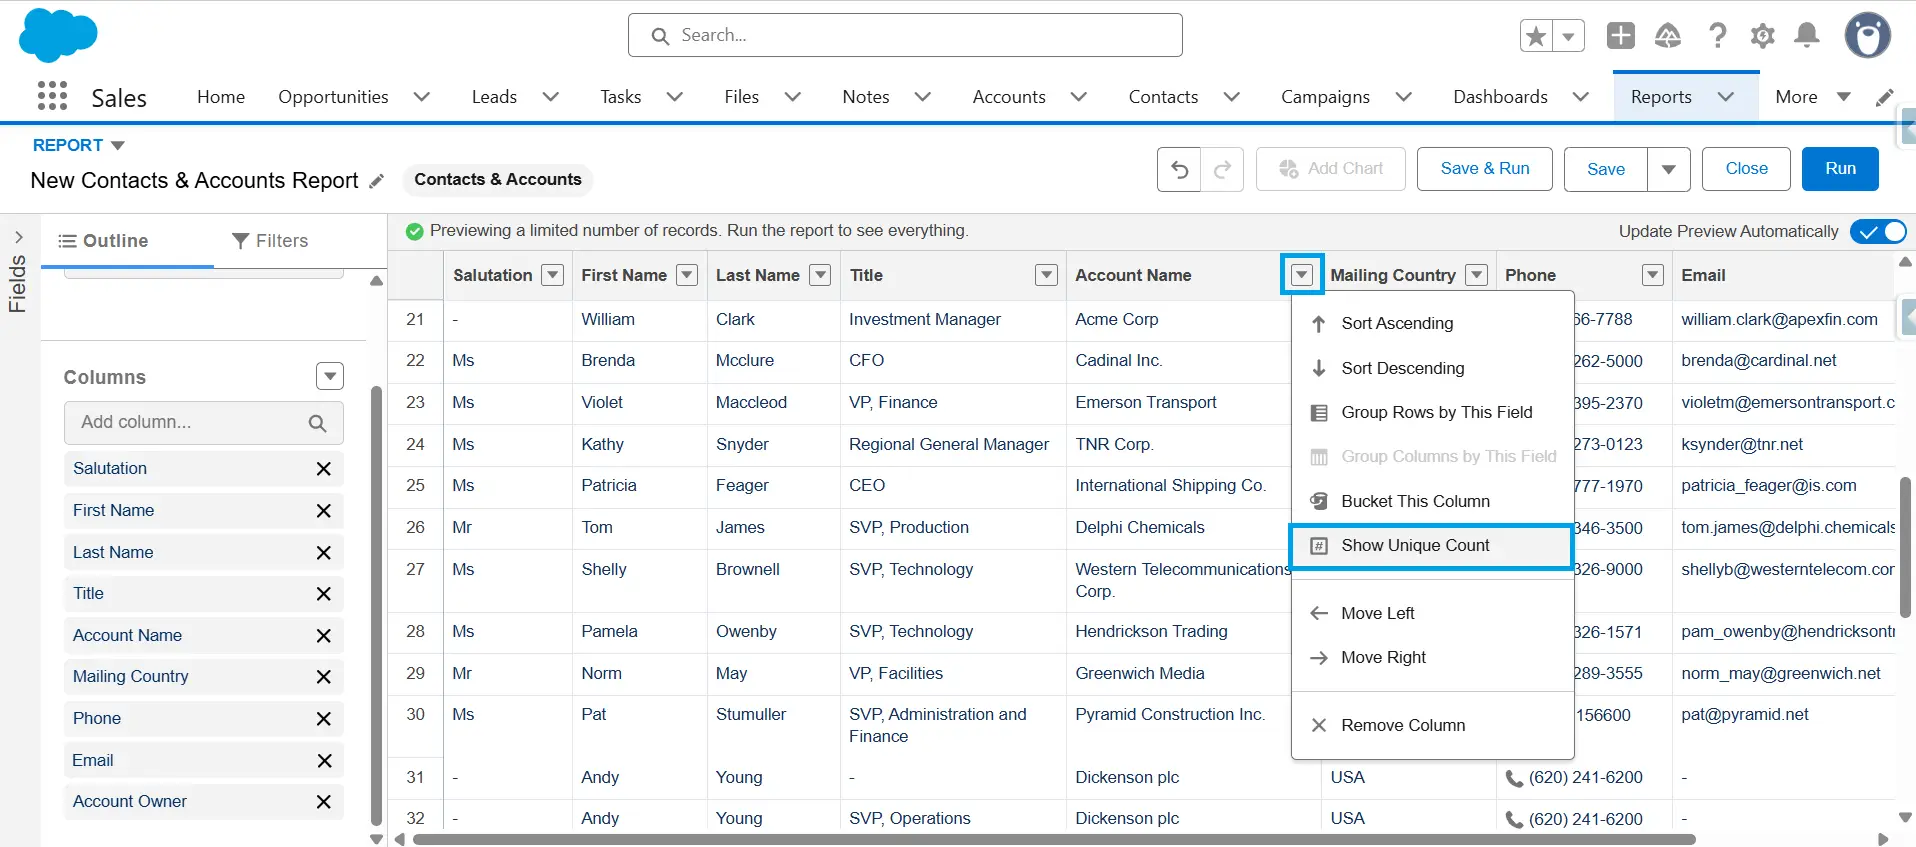
2
Click the dropdown arrow on the column header and select Show Unique Count.
-
3
Click Save.

Salesforce displays the unique count at the report footer, with subtotals at each group level in Summary and Matrix reports.
To remove: Click the More Actions dropdown arrow on the same column header and click on Hide Unique Count.
Required Permissions
-
Create and Customize Reports
-
Report Builder
Availability
| Criteria | Detail |
|---|---|
| Interface | Lightning Experience only. |
| Report Types | Tabular, Summary, Matrix, and Joined |
| Editions | Essentials, Group, Professional, Enterprise, Performance, Unlimited, and Developer editions. Confirm availability in Essentials against current Salesforce edition feature documentation. |
Limitations
-
1
Maximum of 3 unique counts per report. Each report supports up to three Show Unique Count instances. Once reached, Salesforce disables the option on additional columns.
-
2
Unsupported field types
Show Unique Count does not work on:
- Multi-select picklist fields
- Text area fields (long and rich text area)
- Encrypted fields
- Blob/CLOB fields
The More Actions menu will not surface the option for these field types.
-
3
Null values count as unique. Salesforce treats blank or null values as one distinct value. In a 500-row report where 40 rows have no value in the counted column, those 40 rows contribute “1” to the unique count. High null volume skews results.
-
4
Lightning Table dashboard widgets do not display unique counts. Pinning a report to a dashboard via a Lightning Table widget omits the unique count. The count appears only within the report.
When to Use Show Unique Count
-
Count uniques while keeping all rows visible. Count distinct sales reps across closed/won opportunities without collapsing opportunity-level detail.
-
Joined reports where a parent record repeats per child. This is the only native unique-count method available across all four report types, including Joined.
-
Validate report criteria. A mismatch between expected and actual unique counts typically indicates a filter error.
When Not to Use Show Unique Count
-
Need to remove or collapse duplicate rows. Use Summary or Matrix report grouping instead.
-
Target field is unsupported: Multi-select picklists, text areas, encrypted fields, or blob/CLOB fields will not surface the option.
-
Unique count must appear in a dashboard Lightning Table widget: The count will not render in that context.
-
Report already contains three unique counts: Salesforce blocks additional instances.
Use Case
A sales operations analyst tracks closed/won opportunities by user. The report returns 300 rows, one per opportunity, with multiple opportunities per sales rep. The analyst needs a distinct rep count without losing opportunity-level detail.
Enabling Show Unique Count on the Owner Name column displays Unique Count: 28 — 28 unique reps own those 300 opportunities. All 300 rows remain intact.
This method does not remove duplicates. It only changes how the report displays them. The data remains unchanged.
This approach works only in Summary and Matrix reports. Tabular reports do not support grouping. Grouping organizes records by a selected field value. When detail rows are hidden, Salesforce collapses the groups and displays only:
-
Group headers
-
Subtotals
-
Summary values
The report becomes easier to scan while the underlying rows still affect calculations and exports.
What Group By Does and Does Not Do
Grouping does not remove rows from the report:
- Summary calculations still include all rows.
- Expanding a group shows the rows again.
- Details-only exports still include every row.
To create a cleaner report view, combine Group By with hidden detail rows.
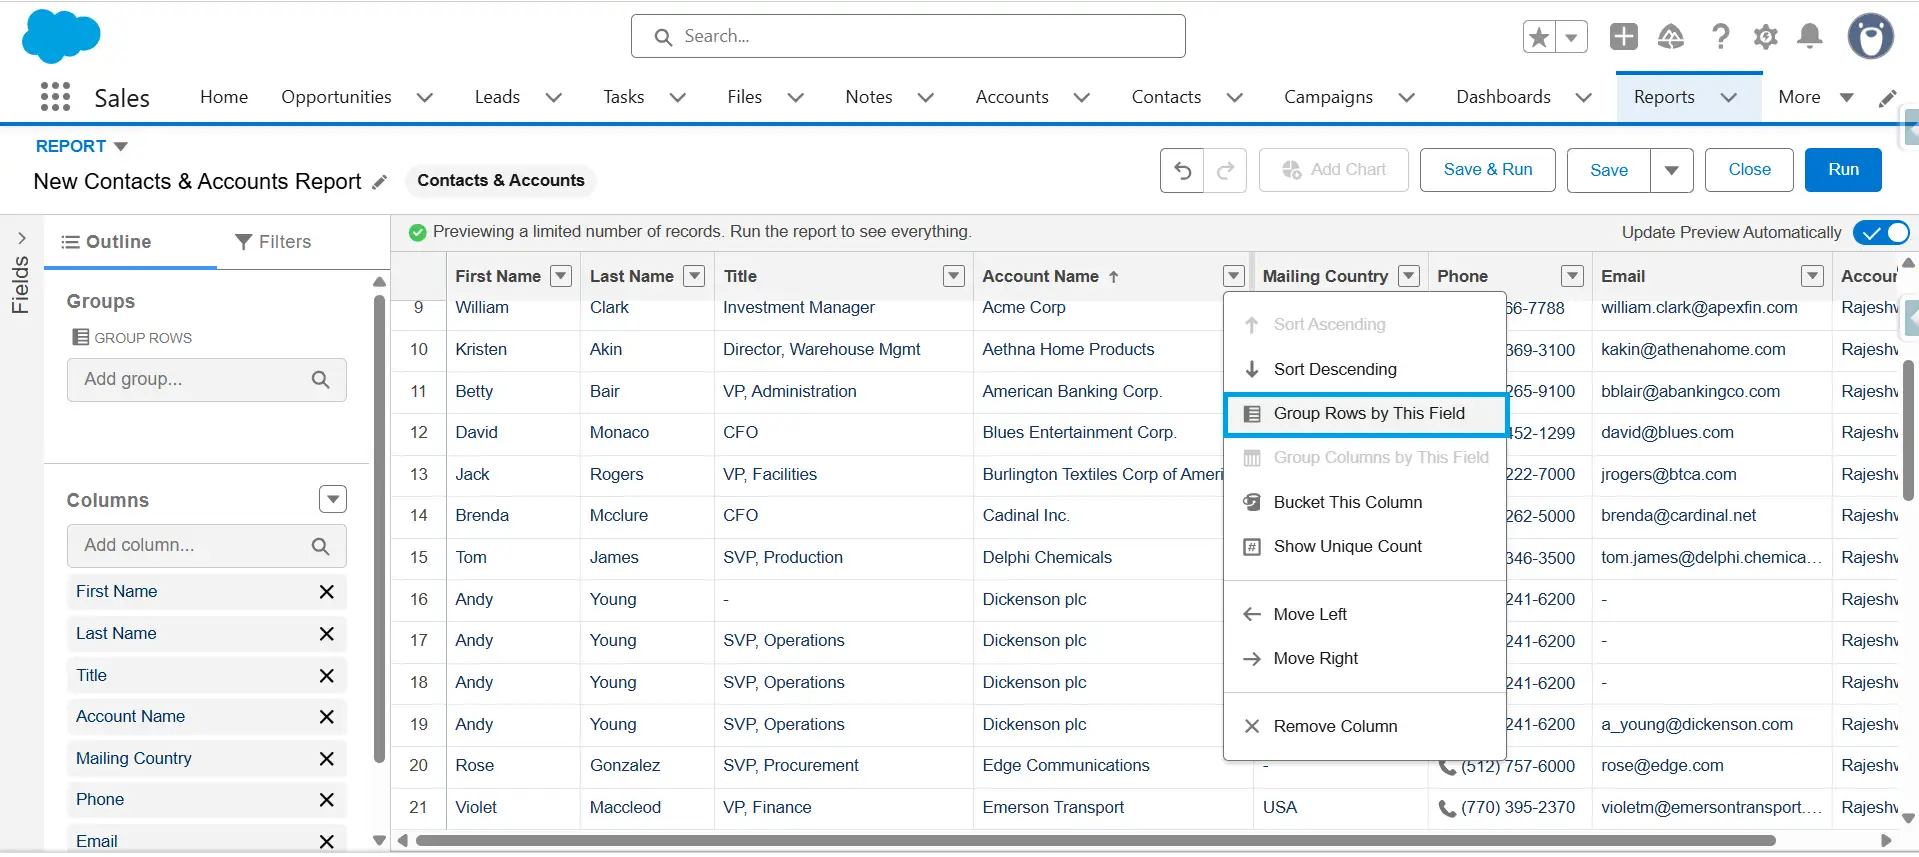
How to Configure It
-
1
Open the report → click Edit.
-
2
Open the column dropdown and select Group Rows by This Field.
-
3
Turn off Detail Rows at the bottom of the preview. Click Save.
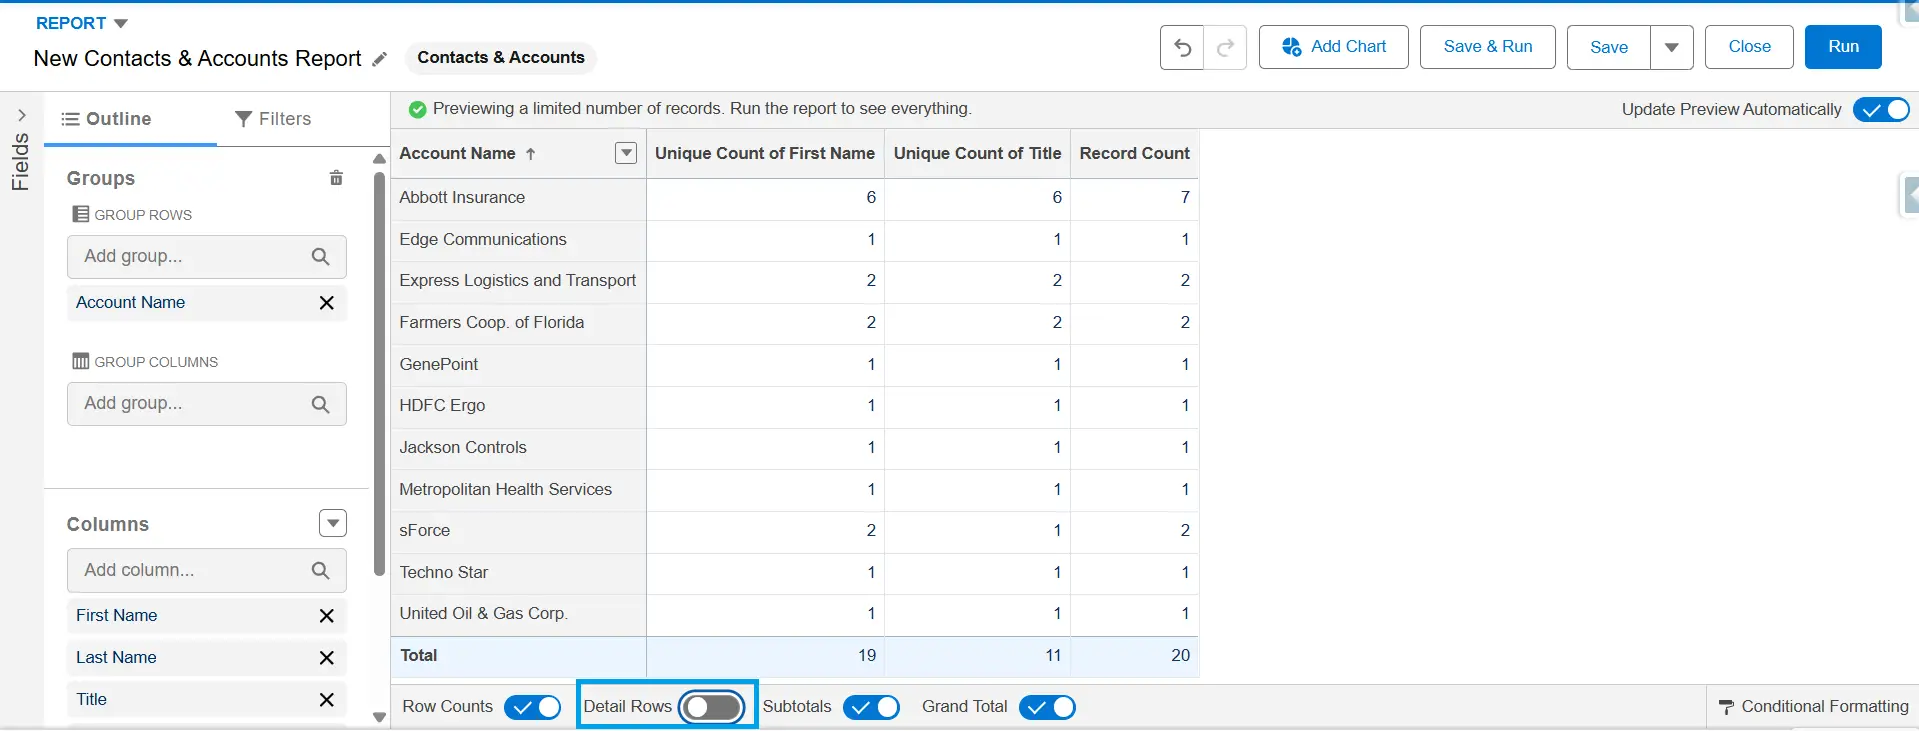
The report now displays collapsed grouped sections instead of individual rows.
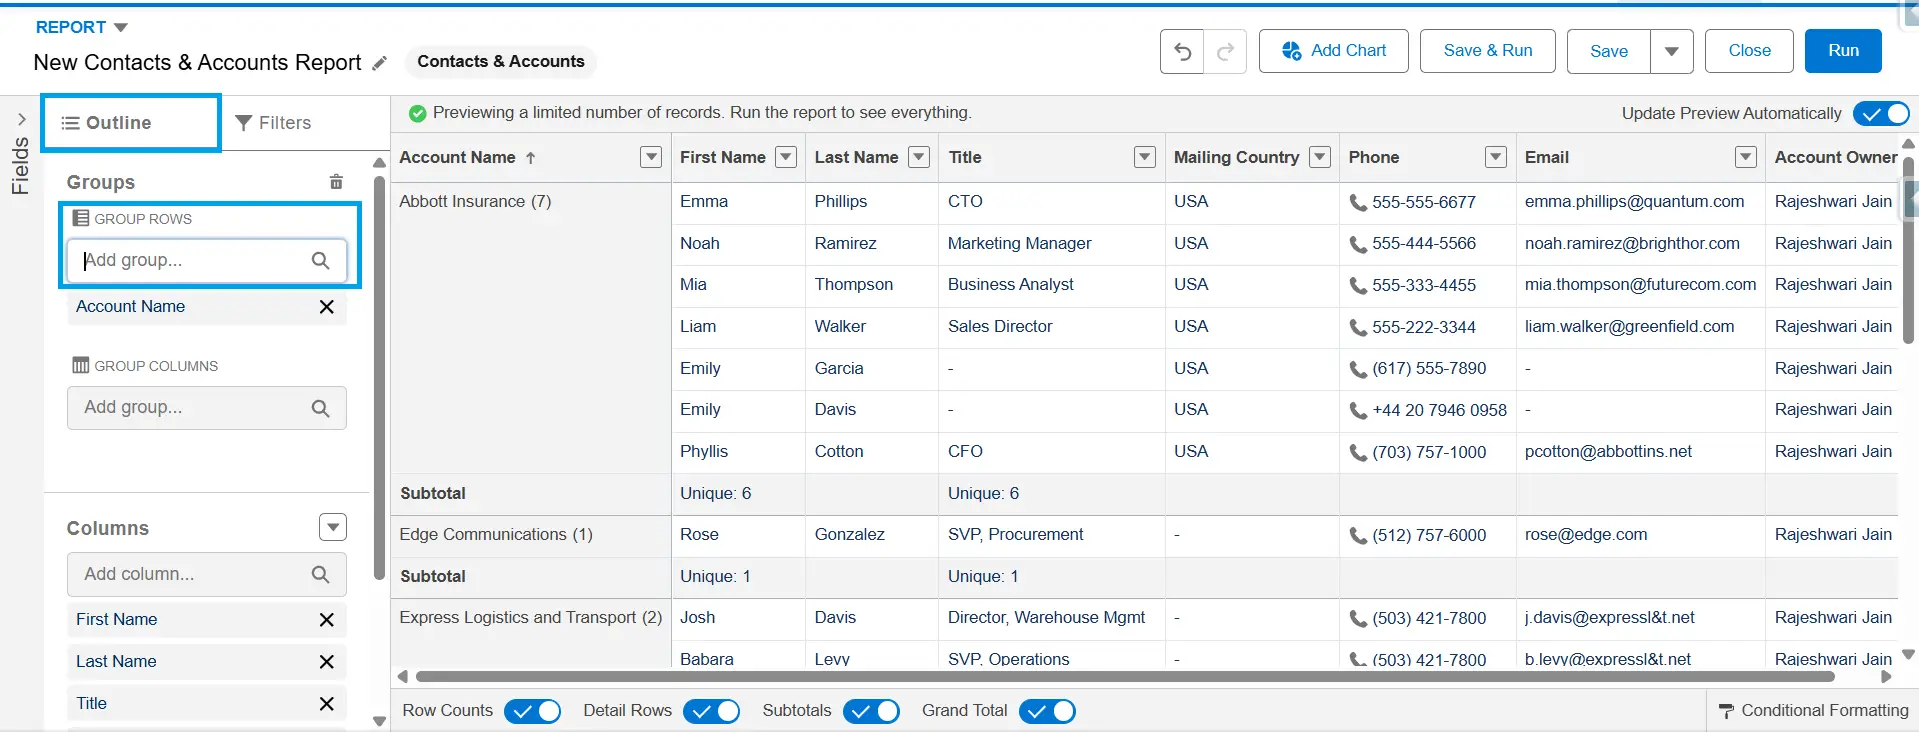
Or you can simply go to the Outline → Group Rows.
What Changes
| Behavior | Result |
|---|---|
| Report view | Shows grouped sections without detail rows |
| Summary calculations | Include all underlying rows |
| Expanding groups | Displays the hidden rows |
| Details Only export | Includes all rows |
| Formatted Report export | Preserves grouping and summaries |
When to Use:
-
The report is intended for presentations or stakeholder reviews.
-
A summarized view is sufficient.
-
Multiple rows represent valid relationships.
-
You want a cleaner grouped layout without changing the data.
Example: One Account has multiple Contacts.
When Not to Use:
-
Calculations must reflect unique records only.
-
Users will export the report in the Details Only format.
-
You need actual deduplication.
-
Repeated rows create reporting inaccuracies.
Cross Filter — Rebuild the Report Instead
If duplicate rows occur because a report includes both parent and child records, rebuilding the report with a Cross Filter is often better than removing duplicates afterward. Cross Filters let you filter parent records based on related child records without showing the child records in the report output.
This is useful when you need a list of parent records that meet criteria on related records but do not need to display those related records.
How Cross Filters Work
In report types that include both parent and child records, a parent record can appear multiple times when multiple related child records meet the report criteria.
Cross Filters use WITH or WITHOUT logic to determine if a parent record qualifies for the report.
A WITH Cross Filter returns parent records with at least one related child record matching the criteria. A WITHOUT Cross Filter returns parent records without related child records meeting the criteria. In both cases, Salesforce evaluates related records to determine eligibility, but those records do not appear in the report output.
For technical readers, the logic of a WITH Cross Filter is similar to the following SOQL query:
SELECT Id, Name
FROM Account
WHERE Id IN (
   SELECT AccountId
   FROM Contact
   WHERE Title = 'Director'
)
How to Configure a Cross Filter
Steps and labels may vary by Salesforce release, but the general process is:
-
1
Open the report and click Edit. Go to the Filters panel.
-
2
Click the filter menu and select Add Cross Filter.
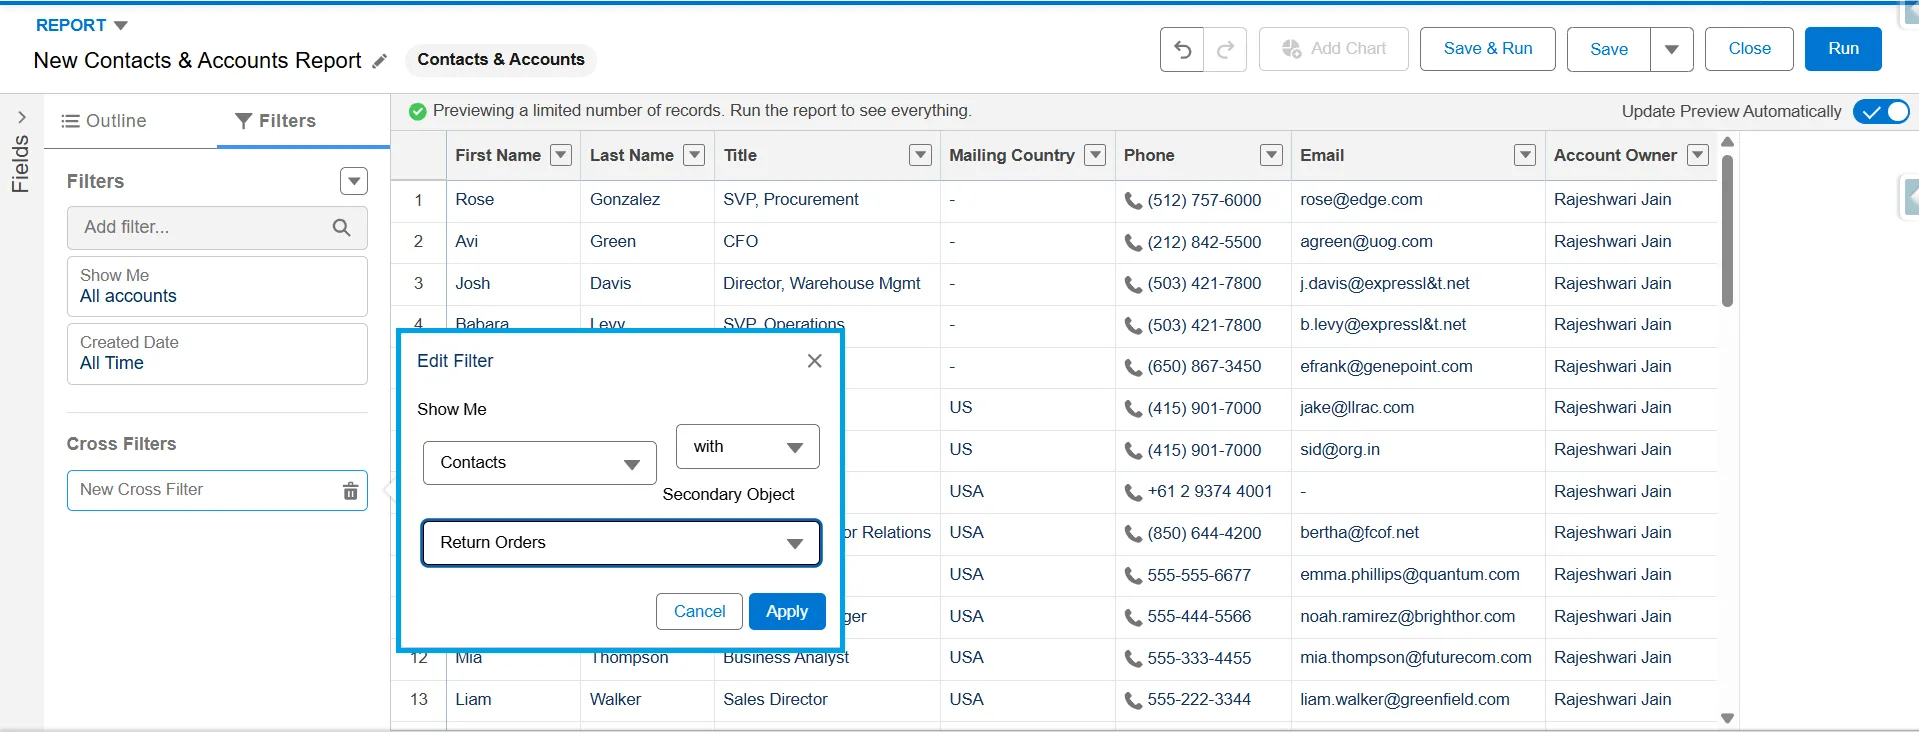
-
3
Choose the parent-child relationship, such as Contacts with Return Orders.
-
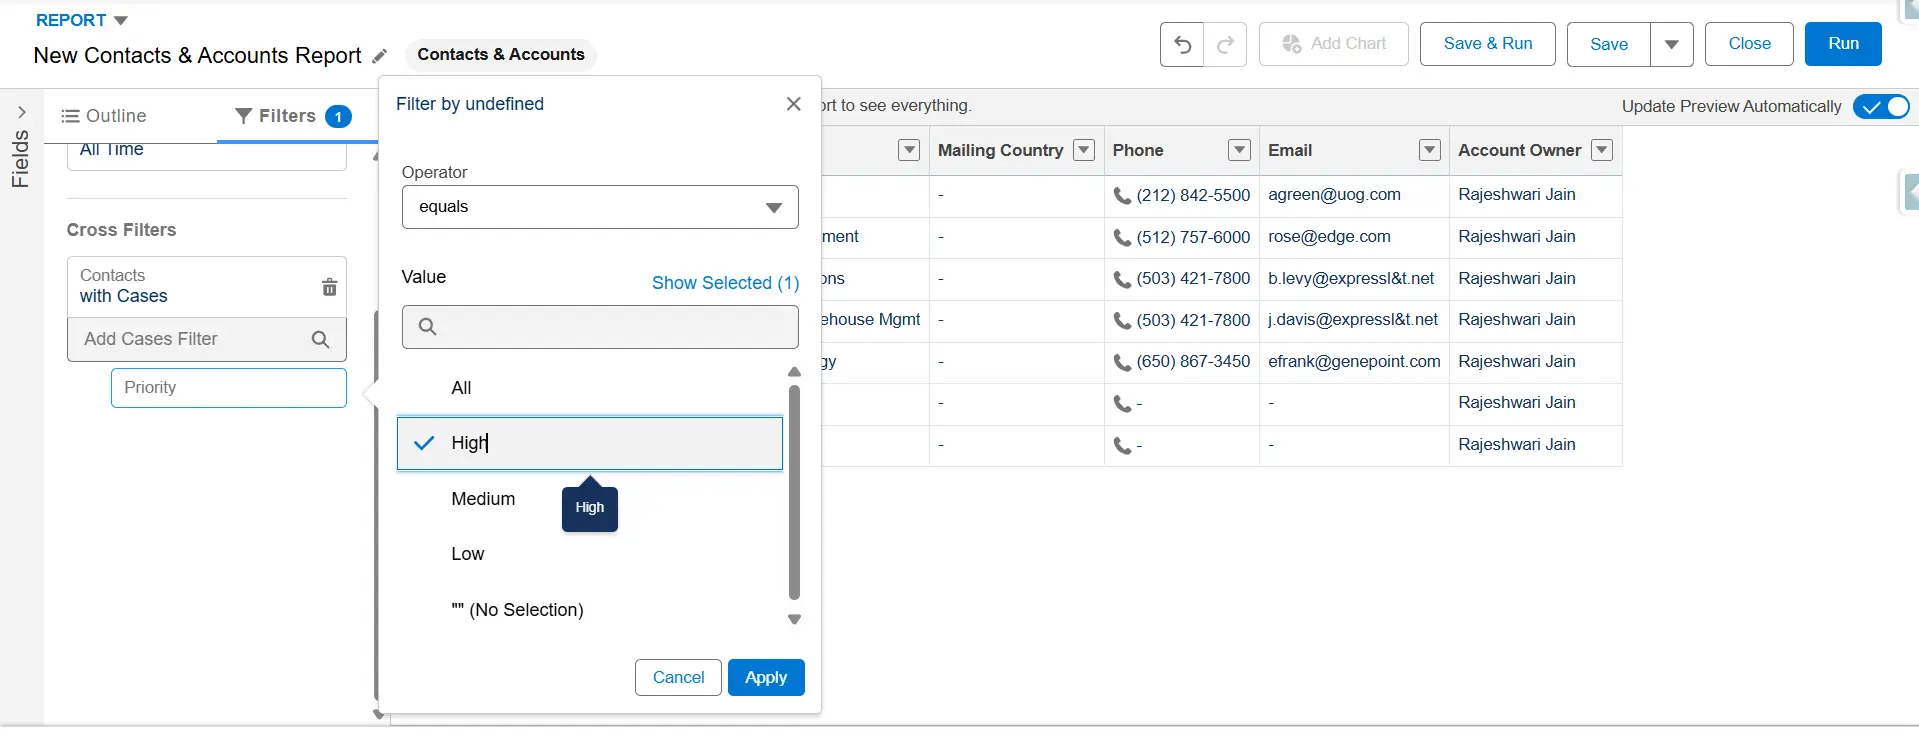
4
You can also add a sub-filter on the child object. Define the criteria, such as Priority equals High.
-
5
Save and run the report.
Salesforce evaluates related child records and returns parent records that meet the filter conditions.
Limitations
Cross Filters are subject to Salesforce reporting limits and support only parent-child relationships available in the selected report type.
Key limitations include:
-
A report can include up to three Cross Filters.
-
Each Cross Filter can include up to five sub-filters.
-
Sub-filters within a single Cross Filter use AND logic.
-
Cross Filters determine if parent records qualify for the report but do not add child-object fields to the output.
-
Cross Filters can affect report performance, especially on large datasets.
When to Use:
-
You need a list of parent records based on child record criteria.
-
Child record details do not need to appear in the report.
-
You want an alternative to report formats that produce multiple rows for the same parent record due to one-to-many relationships.
-
You need to identify records that have or do not have related records.
When Not to Use:
-
You need to display parent and child records together.
-
You need to display fields from related child records in the report output.
-
You need counts, totals, or summaries of child records for each parent.
-
Users need to analyze individual child records.
-
Your reporting requirements depend on data that is not available through the selected report type or Cross Filter relationship.
In these cases, a Summary report with grouping or a different report type is often better.
Use Cases
Accounts with at Least One Director-Level Contact
Suppose you need a list of Accounts that have at least one Contact whose Job Title is “Director.”
An Accounts and Contacts report may show the same Account multiple times when multiple Contacts meet the criteria. A Cross Filter returns qualifying Accounts based on related Contact records without showing Contact details in the report.
Accounts with Opportunities Closed Over $100,000 This Quarter.
Sales teams often need a list of Accounts associated with high-value closed deals.
A Cross Filter can return Accounts with at least one Opportunity closed above $100,000 this quarter without including Opportunity records in the report.
Accounts with Open Cases
Support managers may need a list of Accounts with open Cases.
A Cross Filter can return Accounts with related open Cases while showing only Account records in the report.
Person Accounts Owning Properties Through a Junction Object
Cross Filters support custom relationships, including junction objects.
For example:
- Person Accounts represent property owners.
- Ownership is a custom junction object.
- Property is a custom object.
A Cross Filter can return Person Accounts based on criteria related to Ownership records. Available fields for filtering depend on the report type and relationship setup. If a required field is not available as a Cross Filter sub-filter, consider exposing it through a formula field or adjusting the report design.
Power of One Formula Field (Custom Formula Field Workaround)
Power of One is a term commonly used in the Salesforce community and the Help article titled “Remove Duplicate Child Record Counts within a Report.” Both refer to the same workaround.
It is useful when Show Unique Count is not suitable. For example, Show Unique Count does not support Text Area and Multi-Select Picklist fields, and reports allow a maximum of three unique counts.
How Power of One Works
In parent-child report types like Accounts with Opportunities, Salesforce returns one row per child record. If an Account has multiple Opportunities, the report shows multiple rows for the same Account.
To count parent records instead of child records, create a formula field on the parent object that always returns 1. Add this field to the report and summarize it using Sum. The summed value gives the count of parent records in the report.
Create the Power of One Field
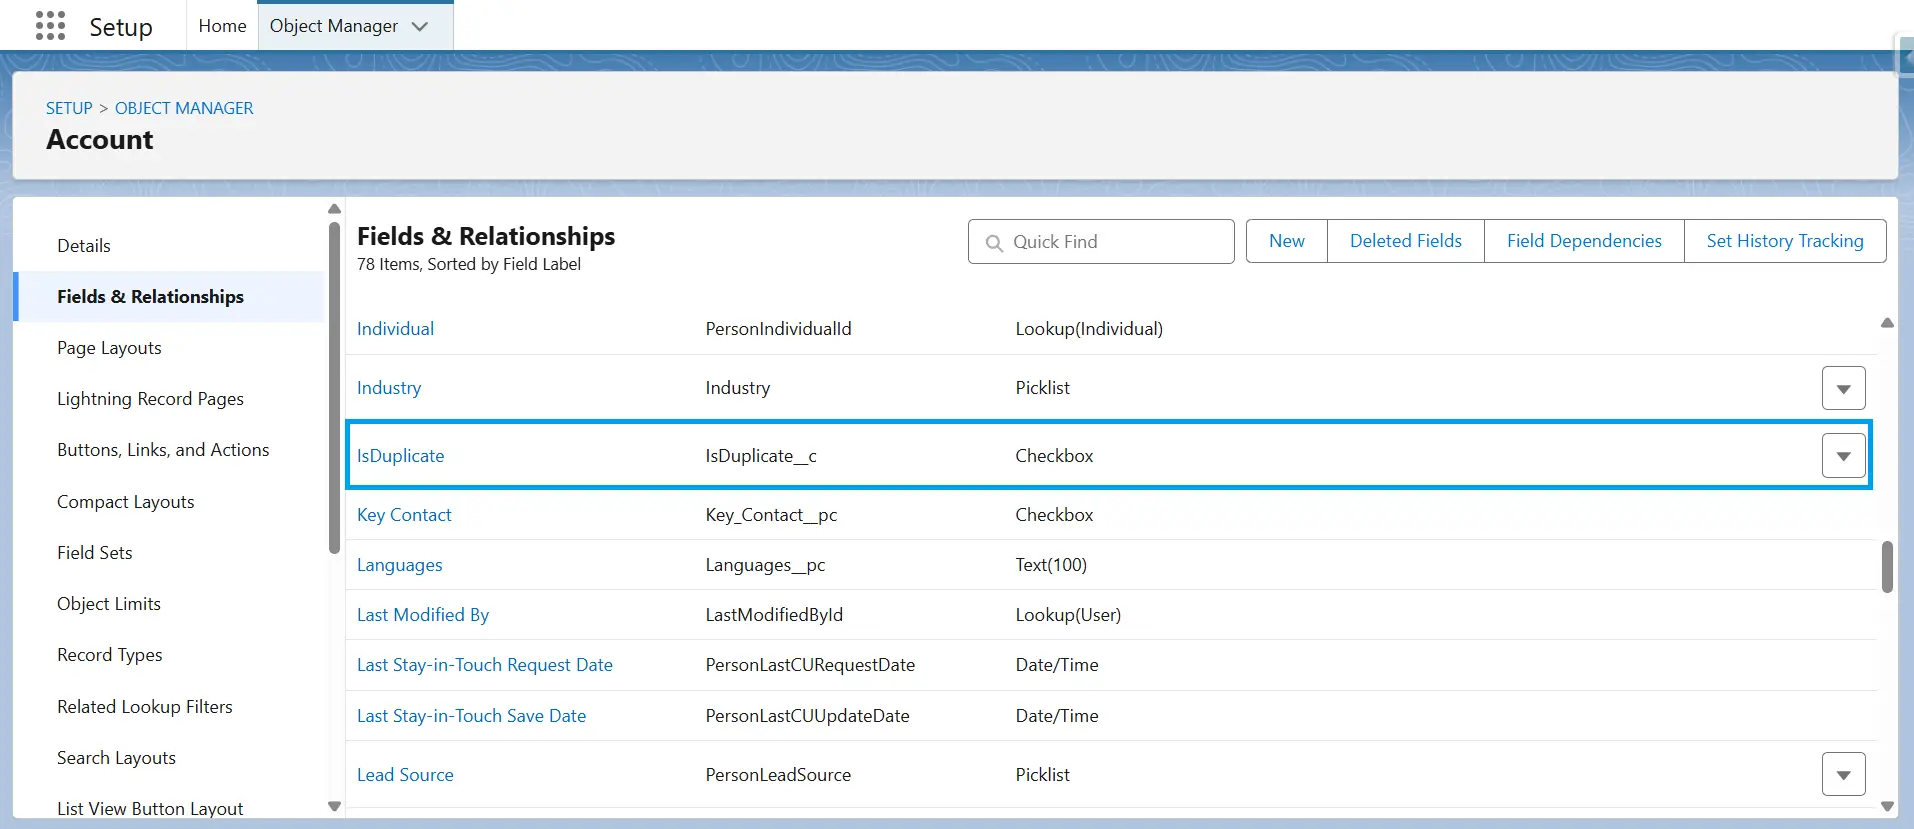
-
1
Go to Setup → Object Manager and open the parent object, such as Account.
-
2
Select Fields & Relationships, click New, and choose Formula as the field type.
-
3
Enter a field label such as Power of One, then select Number as the return type with 0 decimal places.
-
4
In the formula editor, enter 1 and click Check Syntax to validate the formula.
-
5
Click Next, configure field-level security as needed, and save the field.
Use the Field in a Report
-
1
Open or create a parent-child report, such as Accounts with Opportunities.
-
2
Add the Power of One field to the report.
-
3
Open the field menu and select Summarize → Sum.
The Sum value provides the count of parent records in the report.
You need permission to create custom fields. If you lack access, work with a Salesforce administrator or use another reporting method.
Use Cases
The Power of One field can be used in custom summary formulas to calculate percentages, averages, ratios and other report metrics based on parent record counts.
Export the Report and Clean Up in Excel
When Salesforce reporting features cannot address a duplicate scenario, export the report and analyze the data in Excel or Google Sheets. It supports any report type you have permission to export, though very large reports may hit Salesforce’s export row limits and require filtering or scheduling. It gives you complete control over how duplicates are identified and handled.
Manual Approach
The manual approach suits one-time cleanup projects with a small number of records. It lets you inspect data directly and apply custom criteria not available in Salesforce reports.
Steps:
-
1
Run the report and export the results as a CSV or XLSX file.
-
2
Open the file in Excel or Google Sheets.
-
3
Use spreadsheet tools to identify duplicate values:
-
- Remove Duplicates to discard repeated rows and keep one unique copy of each. Note this permanently deletes the extra rows from the sheet.
- Use COUNTIF formulas to flag repeated values for review without deleting anything.
-
-
4
Verify the results before making any data changes.
-
5
If records need to be updated or deleted in Salesforce, perform the changes using a bulk data tool, such as the Data Loader.
Limitations:
-
Requires manual effort, and so it’s not feasible for large datasets.
-
Spreadsheet changes remain local until imported back into Salesforce.
-
Multiple users reviewing the same file can create version-control issues.
Automated Approach with Spreadsheet-Integrated Tools
Spreadsheet integration tools eliminate the need to repeatedly export and reimport files. It connects Excel or Google Sheets directly to Salesforce, letting users retrieve records, apply spreadsheet logic, and update Salesforce from the same workspace.
One commonly used option is XL-Connector. Users can query Salesforce data, identify duplicates using spreadsheet functions, and perform updates without managing separate CSV files.
It’s well-suited for recurring maintenance tasks, larger datasets, and teams who prefer working in spreadsheets while keeping Salesforce data synchronized.
If you’re curious why so many teams lean on this approach, our guide on Salesforce data cleansing in a spreadsheet is worth a read.
Mark and Filter Workflow
Instead of removing duplicates each time a report is generated, flag duplicate records in Salesforce and exclude them through report filters. It helps maintain consistent reporting results.
Steps:
-
1
Export the report to Excel.
-
2
Use a formula such as COUNTIF or Advanced filters to identify duplicate values based on a selected field, such as Email or Phone.
-
3
Create a custom checkbox field, for example IsDuplicate__c, on the relevant object in Salesforce.
-
4
Update the flagged duplicate records and set the checkbox value to TRUE using Data Loader, Salesforce Inspector, or XL-Connector.
-
5
Add a report filter that sets IsDuplicate = False.
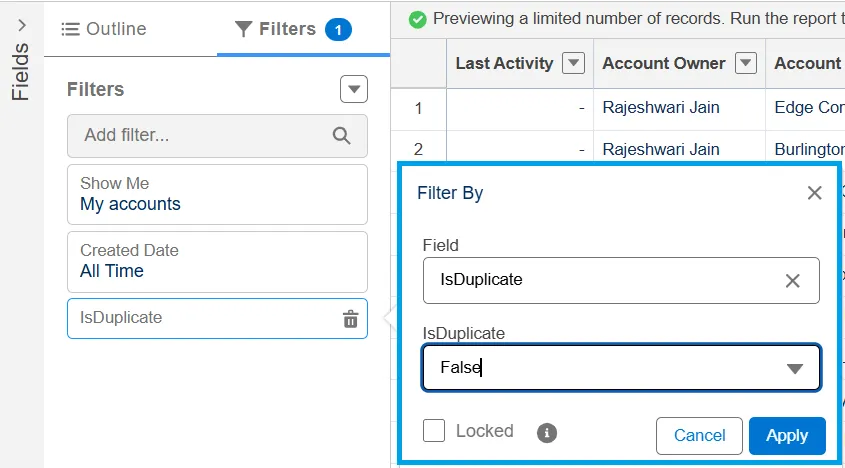
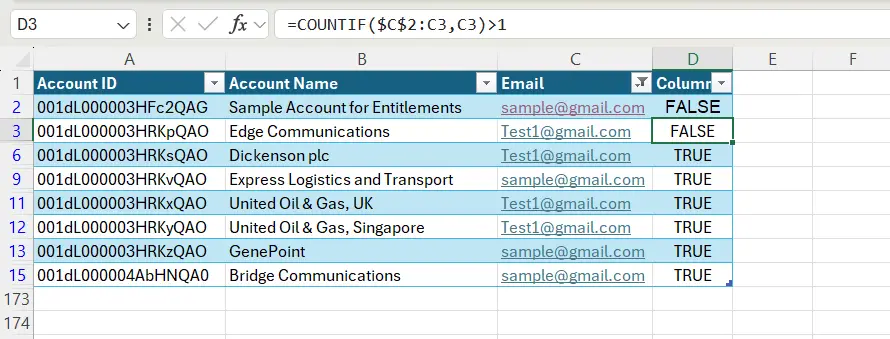
Example COUNTIF Formula
=COUNTIF($C$2:C2,C2)>1
This formula returns FALSE the first time a value appears and TRUE for every later occurrence. As a result, the first record in each duplicate set stays unflagged while the extras are marked. When you set IsDuplicate__c = TRUE on flagged rows and filter your report for IsDuplicate__c = False, you keep one record per duplicate set and hide the rest.
Advantages:
-
Keeps duplicate status visible within Salesforce.
-
Supports consistent filtering across multiple reports.
-
Preserves records for auditing and investigation.
This method offers flexibility when report-level solutions are not sufficient and provides a practical way to manage duplicates using spreadsheet tools and Salesforce updates.
Which Method Should You Use?
| Your Scenario | Best Method | Report Types | Key Consideration |
|---|---|---|---|
| Count unique values while keeping all rows visible | Show Unique Count | All report types | Supports up to three unique counts per report; available only for supported field types |
| Create a summary view without record-level details | Group By + Hide Detail Rows | Summary and Matrix reports | Changes report display only; data remains unchanged |
| Return unique parent records that meet child record criteria | Cross Filter | Parent-child report types | Check current Salesforce limits and supported conditions |
| Need a unique count of records when Show Unique Count cannot be used | Power of One formula field | Any object where a custom formula field can be added | Counts distinct records (for example, parent records in parent-child reports), not arbitrary field values; requires creating a custom formula field |
| Apply custom deduplication rules or identify near-duplicates | Export to Excel | Any report with export access | Requires manual analysis or tools such as XL-Connector |
| Duplicate records exist in Salesforce, not only in the report | Data-layer cleanup | N/A | Use Salesforce duplicate management tools to merge, delete, or prevent duplicates |
FAQ
Can I remove duplicate records directly from a Salesforce report?
No. Salesforce reports do not include a feature that removes duplicate records from report results. Show Unique Count counts distinct values, while Group By and Hide Detail Rows create a summarized view. If repeated rows are caused by parent-child relationships, consider rebuilding the report with a different report type or using a Cross Filter when you only need to identify parent records with or without related records. To remove duplicate records from Salesforce, use a separate cleanup process.
Why does my Salesforce report show the same record multiple times?
This usually happens because of the report structure. For example, an Account appears once for every related Contact in an Account-with-Contacts report. In this case, the records are not duplicates. Use Show Unique Count to see how many unique parent records are represented in the report. If separate records contain the same email address or other matching values, you may have actual duplicate data.
How do I show unique rows only in a Salesforce report?
Use Show Unique Count on a column to count distinct values in the report. This feature does not remove duplicate rows; it adds a unique count to the report summary. For a cleaner view, group records by a field and hide detail rows. If you need to filter parent records based on related records, use a Cross Filter.
Does Group By remove duplicates in Salesforce reports?
No. Group By organizes records that share the same value, but the underlying rows remain in the report. Summary calculations still include all matching records. To create a condensed view, combine grouping with Hide Detail Rows. For distinct counts, use Show Unique Count. For actual duplicate removal, use a data-cleanup process.
What if I don’t have admin permissions to set up Duplicate Rules or create custom fields?
You can identify duplicate data without admin access. Show Unique Count, Group By with Hide Detail Rows, and Cross Filters are available to users who create or customize reports. You can also export the report and remove duplicates in Excel. For permanent data cleanup, work with a Salesforce administrator.
Can I export a Salesforce report and remove duplicates in Excel?
Yes. Export the report as a CSV file and use Excel’s Remove Duplicates feature or a formula like COUNTIF to identify duplicate values. This process only affects the exported file. Duplicate records remain in Salesforce. To update Salesforce, use the Data Loader or another Excel-based data management tool, such as XL-Connector.
What’s the difference between Show Unique Count and Cross Filter?
These features solve different reporting problems. Show Unique Count displays the number of distinct values in a column and keeps all report rows visible. Cross Filters include or exclude parent records based on related child records and their criteria. Use Show Unique Count when you need a distinct count. Use Cross Filters when you need to refine which records appear in the report.
Conclusion
Salesforce reports do not include a “Remove Duplicates” button. However, native features let you count unique values, hide duplicate rows in summary views, filter records, or export data for cleanup. The right method depends on the report type and the result you want. To merge or delete duplicate records, use Salesforce’s duplicate management tools like Matching Rules, Duplicate Rules, and record merge processes, as covered in our related guide.
Rajeshwari Jain
Content Manager
Rajeshwari Jain is a Technical Support Specialist and Content Writer at Xappex. She applies her practical experience to assist customers and create articles on how Xappex tools work with Salesforce to improve data management and increase efficiency.
She began her IT career in 2022 as a Quality Assurance professional before transitioning into Salesforce administration and technical writing in 2023. With Salesforce Certified Administrator and Associate certifications, Rajeshwari writes blogs on Salesforce flows, admin tools, and updates to expand her skills outside of work.
In her free time, she enjoys reading tech blogs and experimenting with new tools.
Feel free to reach out to Rajeshwari for collaborations or to check out her Salesforce-focused content.